In Part 2 we had a look at connecting hardware and toggling the state on two LED’s using a form and a method VI.
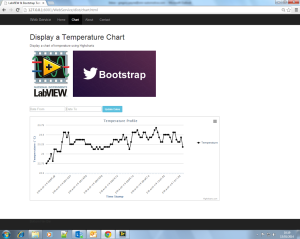
Moving to the next stage of my project, I added a DS18B20 temperature sensor to log the temperature at set intervals. This interval is defined by using a variable constant. The temperature is logged to an SQLite3 database and when queried, displays the temperature profile in a Highcharts chart in the browser. Dates to display are chosen using a jQueryUI datepicker.
Logging temperature:
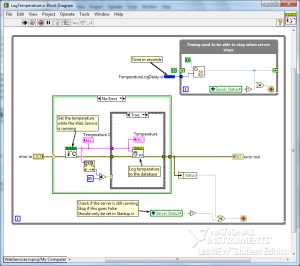
Temperature is logged every 60 seconds as set by Constants.lvlib:TemperatureLogDelay.vi. This VI is opened and run by reference from within Startup.vi when the server is started. It continues to run in the background as long as the server is running.
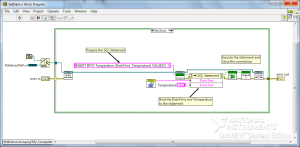
Once the temperature has been read from the LaunchPad, it is logged in an SQLite3 database. I used a library written by Dr James Powell which can be downloaded from the LAVA Code Repository.
The temperature is logged alongside the current date and time. The data and time string is used to choose what date range to display in the chart.
Query the temperature:
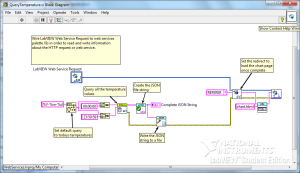
To query the database for the temperature range that we want to display, I use a jQueryUI datepicker. This gives me the dates that I want to look at and then I add the time in LabVIEW. I use a form with another GET method to pass the dates into LabVIEW and then I run the query there.
The data gets returned from the query in the form or arrays.
Create JSON file:
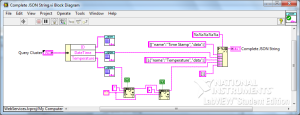
Once I have an array of dates and temperatures, I need to reformat the arrays into a JSON string which Highcharts can understand. I start off my formatting each array into the correct format string and then create the complete JSON string.
This string is then written to a .json file which is read by the javascript to display the chart.
Adding static files:
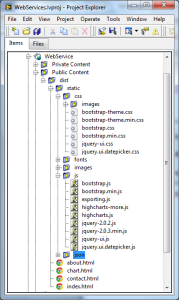
As we are using more API’s, we need to add these files to the static directories. To the static/css directory, add the jQuery datapicker theme. To the static/js directory, add the Highcharts, jQuery and jQuery datapicker js files.
Editing chart.html:
The last thing to do is to add the <script> and html code to display the datepicker and chart.
If no dates are selected, the today’s dates will be chosen by default.
A JSON file is then created from the query results. This file is saved into the static/json directory where it is read from within the script.
The webpage is then updated with the chart showing the temperatures for the dates selected. The settings of the chart and also the type of chart can be changed to whatever you like. Have a look at the Highcharts API for all the options.
That is all for Part 3. You can find Part 2 here and Part 1 here. The completed project so far can be downloaded from below.
As always, comments and tips are always appreciated.
Download LabVIEW Web Services Part 3
Greg
